1. Distribution Plots
- distribution plots는 데이터의 분포를 보기 위한 데이터 시각화 그래프이다.
- seaborn의 distribution plots는 histplot, kdeplot, ecdfplot, rugplot, displot 다섯가지가 있다.
- 데이터의 평균, 중위수, 범위, 분산, 편차 등을 이해할 수 있다.
2. Distribution Plots의 그래프 종류
2-1. Hist Plot
- histplot은 히스토그램으로 변수의 분포를 구간별로 나누어 막대그래프로 나타낸다.
- 구간은 bins를 이용하여 직접 정할 수 있다.
sns.histplot(data=penguins, x="flipper_length_mm", bins=30)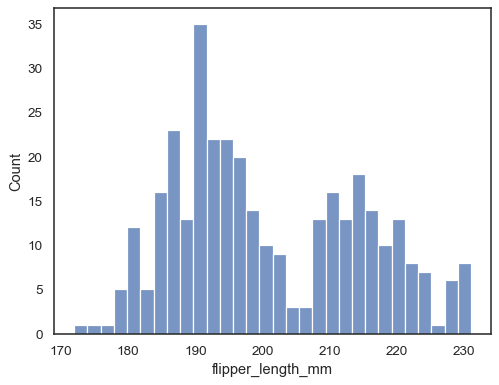
- hue를 사용하여 변수 하나를 더 추가해 다른 색으로 구분지을 수 있다.
- 주로 범주형 변수를 추가할 때 사용하며, groupby와 같은 효과를 볼 수 있다.
sns.histplot(data=penguins, x="flipper_length_mm", hue="species")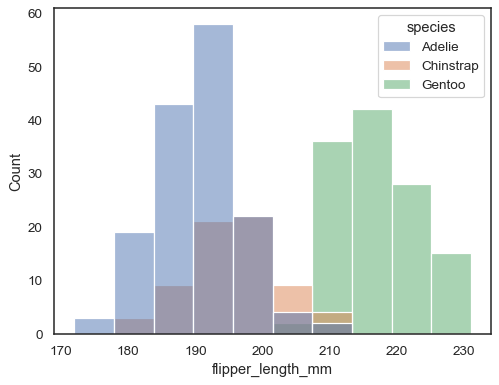
다음은 hist plot 사용법에 관한 다양한 방법들이 있다.
hist plot 사용법
2-2. Kde Plot(Kernel density estimation Plot)
- kdeplot은 커널 확률(밀도) 추정 그래프로 밀도를 적분했을 때 1이 되는 값을 그래프로 나타낸 것이다.
- 그 결과물로 연속된 곡선의 그래프가 나온다.
sns.kdeplot(data=tips, x="total_bill")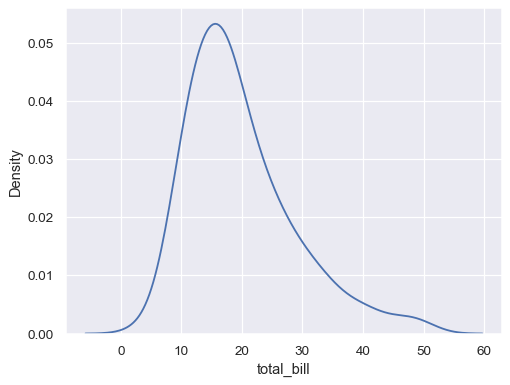
- hue를 사용하여 hue로 지정한 변수로 구분지을 수 있다.
sns.kdeplot(data=tips, x="total_bill", hue="time")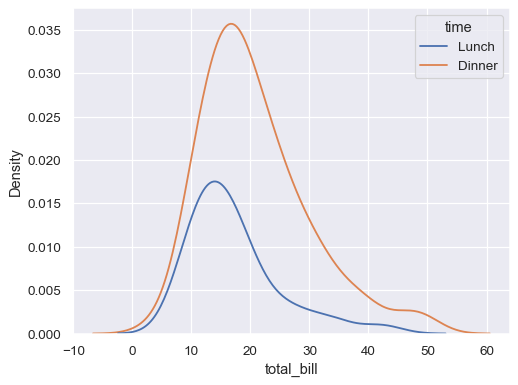
다음은 kde plot 사용법에 관한 다양한 방법들이 있다.
kde plot 사용법
2-3. Ecdf Plot
- ecdfplot은 데이터의 관찰 비율 또는 개수를 그래프로 나타낸다.
- 관찰이 직접 시각화 된다는 장점이 있습니다.
sns.ecdfplot(data=penguins, x="flipper_length_mm")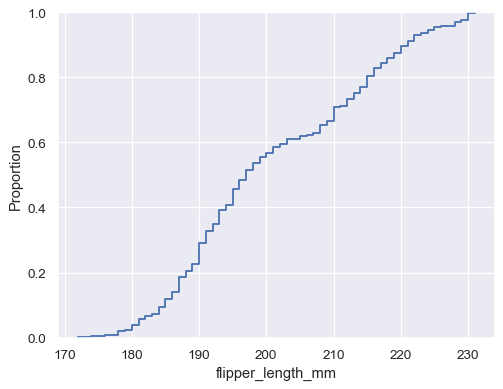
- hue를 사용하여 hue로 지정한 변수로 구분지을 수 있다.
sns.ecdfplot(data=penguins, x="bill_length_mm", hue="species")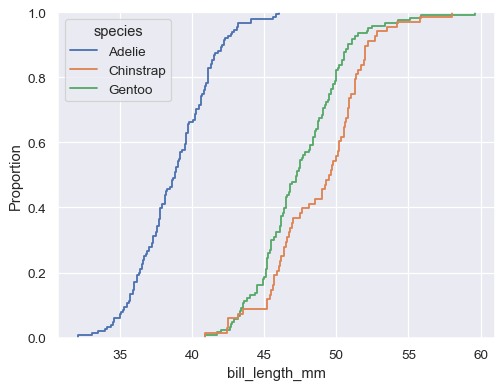
다음은 ecdf plot 사용법에 관한 다양한 방법들이 있다.
ecdf plot 사용법
2-4. Rug Plot
- rugplot은 x축 및 y축을 따라 눈금을 그려 주변 분포도를 나타낸다.
- 개별 관측치에 대한 위치를 보여줌으로써 다른 그림들을 보완하는데 주로 쓰인다.
    sns.kdeplot(data=tips, x="total_bill")
    sns.rugplot(data=tips, x="total_bill")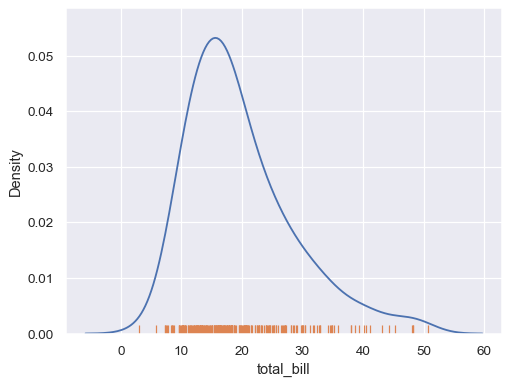
다음은 rug plot 사용법에 관한 다양한 방법들이 있다.
rug plot 사용법
2-5. Dis Plot
- displot은 distribution plots의 모든 그래프들의 상위 개념이다.
- kind를 이용하여 모든 그래프들을 그릴 수 있으며 디폴트값은 histplot이다.
- kind = 'kde'을 쓰면 kde plot이 kind = 'ecdf'를 쓰면 ecdf plot 그래프가 그려진다.
sns.displot(data=penguins, x="flipper_length_mm")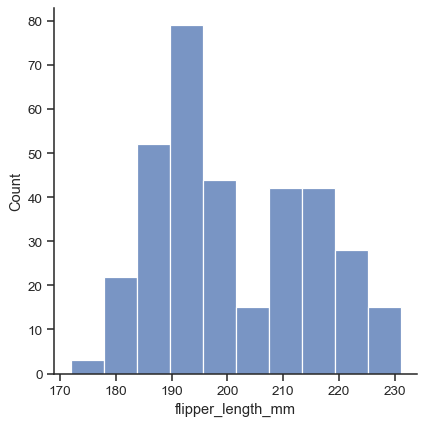
sns.displot(data=penguins, x="flipper_length_mm", kind="kde")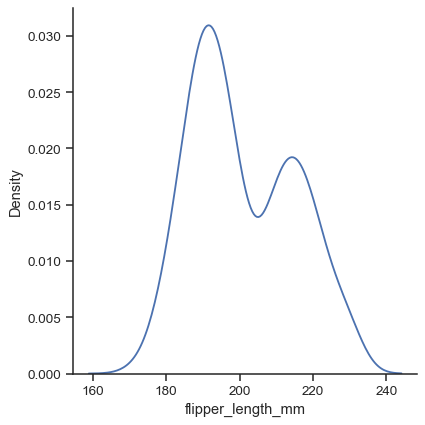
- rug=True를 사용하여 rug 그래프도 포함시킬 수 있다.
g = sns.displot(data=penguins, x="flipper_length_mm", y="bill_length_mm", kind="kde", rug=True)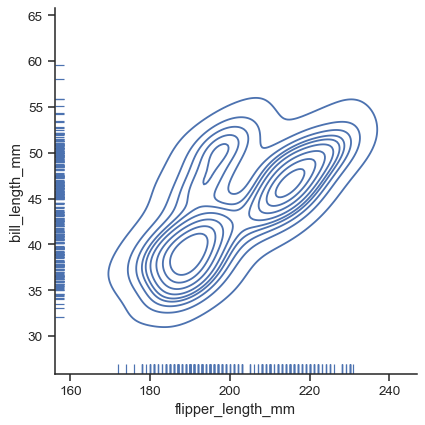
- displot의 가장 큰 장점은 col이나 row를 사용하여 여러 변수에 관한 여러개의 그림을 그릴 수 있다.
sns.displot(data=penguins, x="flipper_length_mm", hue="species", col="sex", kind="kde")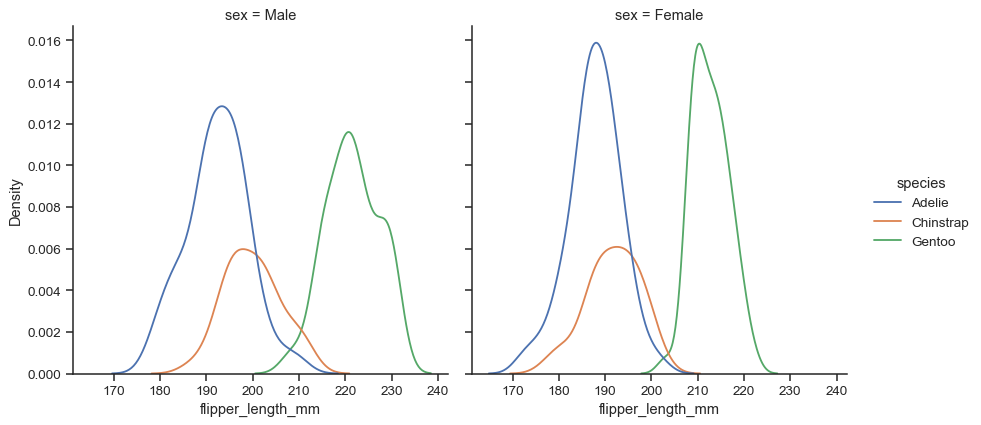
다음은 rug plot 사용법에 관한 다양한 방법들이 있다.
dis plot 사용법
'Python' 카테고리의 다른 글
| [Pandas] 데이터 수집 - 웹스크래핑(Json) (0) | 2022.09.30 |
|---|---|
| [Pandas] 데이터 수집 - 웹스크래핑 (0) | 2022.09.29 |
| [Seaborn] Relational Plots (0) | 2022.09.27 |
| [Seaborn] 들어가기 (0) | 2022.09.26 |
| Pandas(1) (0) | 2022.09.22 |

